Student Performance Analysis
Project Overview
Key Questions
- Which factors (gender, parental education, lunch, test prep) are associated with higher scores?
- Is there correlation between math, reading, and writing scores?
- Does completing test preparation improve outcomes?
- Which student groups perform below expected levels and why?
Dataset
Primary dataset: Students Performance in Exams — Kaggle
Columns included: gender, race/ethnicity, parental level of education, lunch, test preparation course, math score, reading score, writing score.
Tools & Files
Tools
- Excel — initial exploration & pivot tables
- Power BI — interactive dashboard
Data Cleaning Summary
- Renamed all column names to Title Case.
- Standardized Gender values — Female → F, Male → M.
- Normalized text values in Race/Ethnicity, Parental Level of Education, Lunch, Test Preparation Course.
- Handled missing values using Excel formulas and filters.
- Added Average Score column with rounding.
- Created Performance Category column to classify results.
Before Cleaning (Sample of 10 Rows)
| gender | race/ethnicity | parental level of education | lunch | test preparation course | math score | reading score | writing score |
|---|---|---|---|---|---|---|---|
| female | group b | bachelor's degree | standard | none | 72 | 72 | 74 |
| male | group c | some college | free/reduced | completed | 69 | 90 | 88 |
| female | group b | master's degree | standard | none | 90 | 95 | 93 |
| male | group d | high school | standard | none | 47 | 57 | 44 |
| female | group c | associate's degree | free/reduced | none | 76 | 78 | 75 |
| female | group b | some college | standard | completed | 88 | 95 | 92 |
| male | group e | associate's degree | standard | none | 59 | 66 | 63 |
| female | group d | high school | free/reduced | none | 40 | 52 | 43 |
| male | group a | some high school | free/reduced | none | 57 | 58 | 54 |
| female | group c | some college | standard | completed | 77 | 85 | 82 |
After Cleaning (Sample of 10 Rows)
| Gender | Race/Ethnicity | Parental Level of Education | Lunch | Test Preparation Course | Math Score | Reading Score | Writing Score | Average Score | Performance Category |
|---|---|---|---|---|---|---|---|---|---|
| F | Group B | Bachelor's Degree | Standard | None | 72 | 72 | 74 | 72.67 | High |
| M | Group C | Some College | Free/Reduced | Completed | 69 | 90 | 88 | 82.33 | High |
| F | Group B | Master's Degree | Standard | None | 90 | 95 | 93 | 92.67 | High |
| M | Group D | High School | Standard | None | 47 | 57 | 44 | 49.33 | Low |
| F | Group C | Associate's Degree | Free/Reduced | None | 76 | 78 | 75 | 76.33 | Average |
| F | Group B | Some College | Standard | Completed | 88 | 95 | 92 | 91.67 | High |
| M | Group E | Associate's Degree | Standard | None | 59 | 66 | 63 | 62.67 | Average |
| F | Group D | High School | Free/Reduced | None | 40 | 52 | 43 | 45.00 | Low |
| M | Group A | Some High School | Free/Reduced | None | 57 | 58 | 54 | 56.33 | Low |
| F | Group C | Some College | Standard | Completed | 77 | 85 | 82 | 81.33 | High |
Only first 10 rows are displayed for comparison before and after cleaning.
Data Analysis & Visualizations
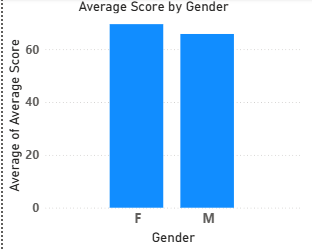
Step 1: Student Performance by Gender
Comparison of average scores between Female (F) and Male (M) students using Power BI visuals.
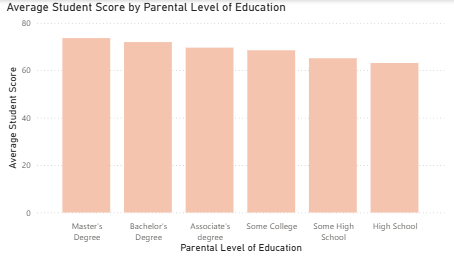
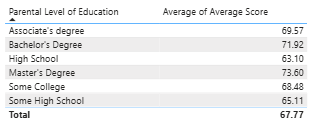
Step 2: Performance by Parental Level of Education
Clustered column chart and table visual in Power BI showing average scores by parental education level.
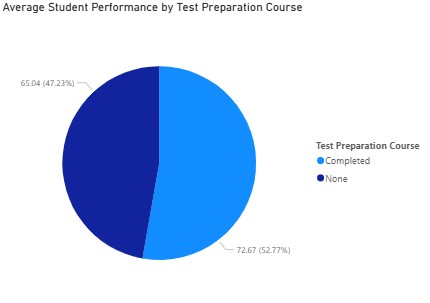
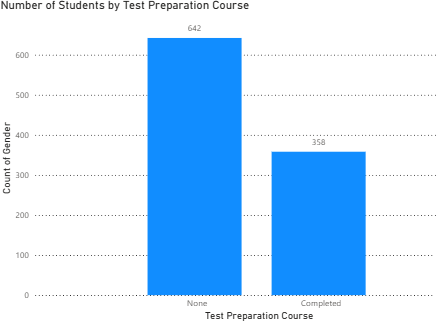
Step 3: Effect of Test Preparation Course
Comparison of students who completed the course vs. those who did not.
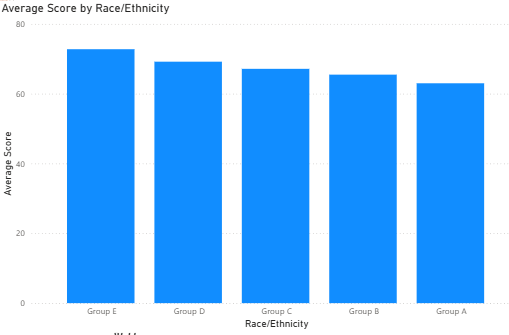
Step 4: Performance by Race/Ethnicity
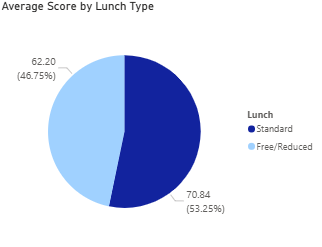
Step 5: Performance by Lunch Type
Project Summary & Insights
- Students whose parents have higher education levels tend to score higher.
- Test preparation courses increase average scores by 7 points.
- Female students slightly outperform male students on average.
- Students receiving standard lunch perform better than free/reduced lunch students.
- Race/ethnicity shows performance gaps that may relate to external socioeconomic factors.